-
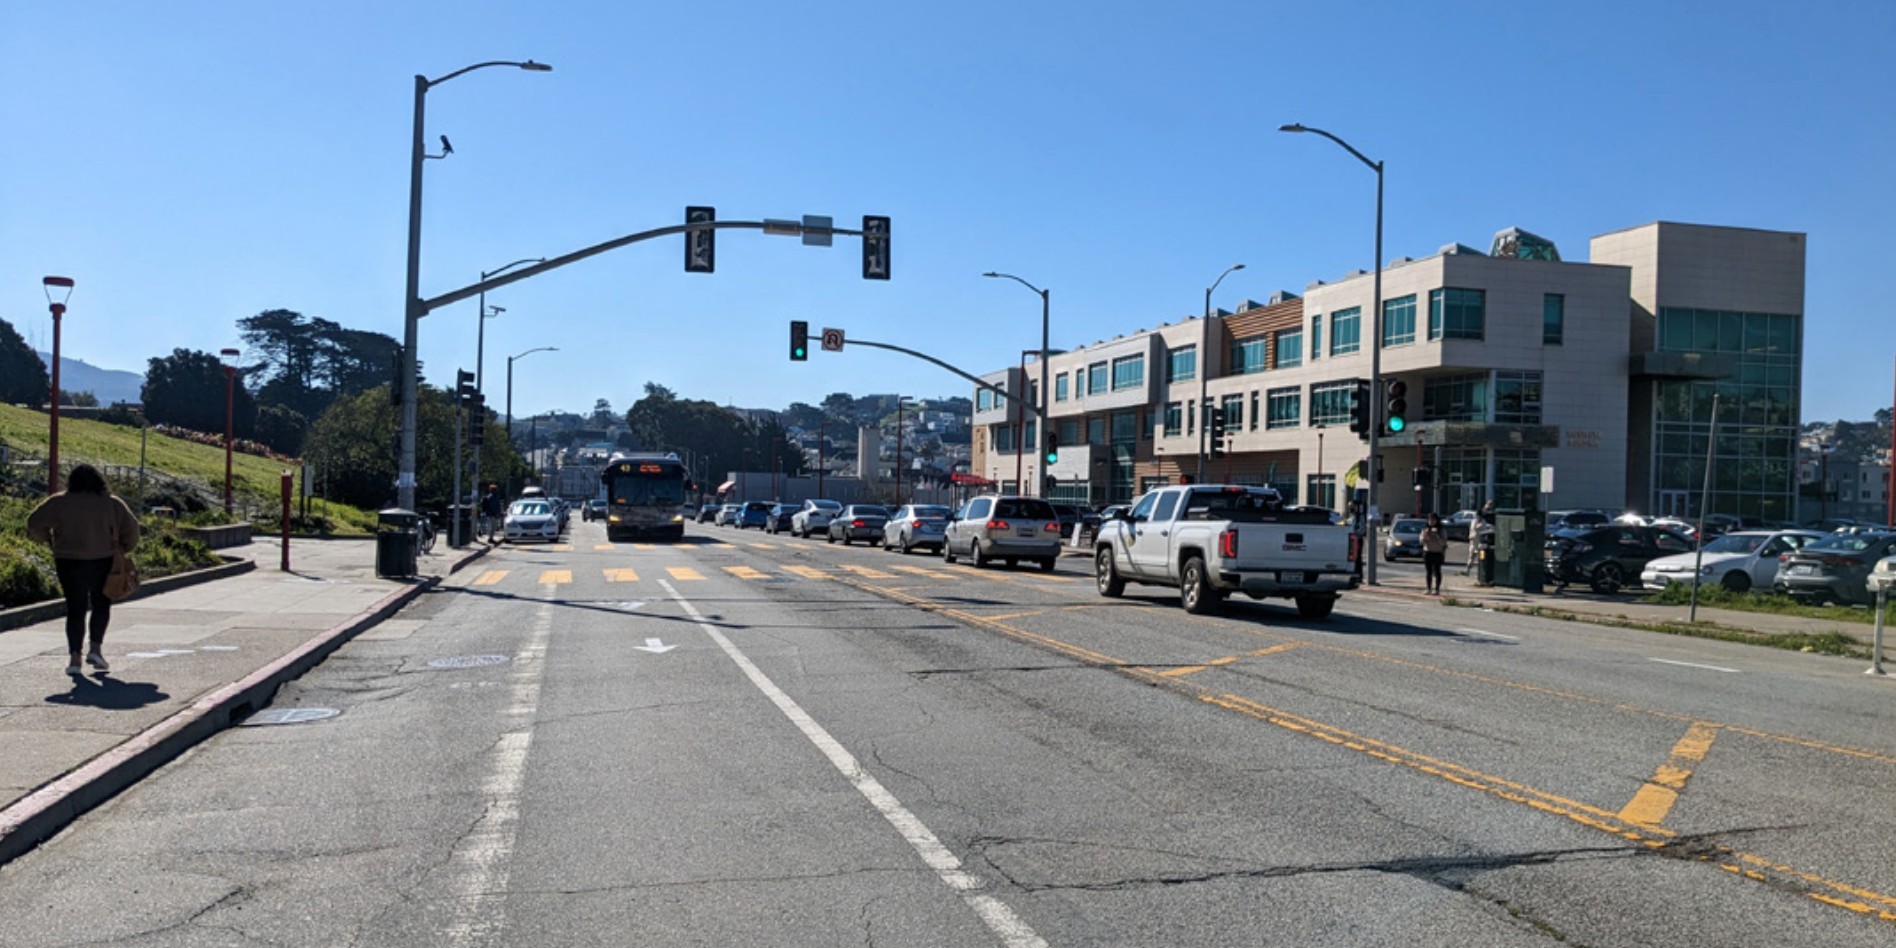
Frida Kahlo Quick-Build Updates
Learn more about progress on the Frida Kahlo Quick-Build and stay updated.
-
OUR 2023-2024 STRATEGIC PLAN
Learn about our organizations strategic plan and priorities.
-
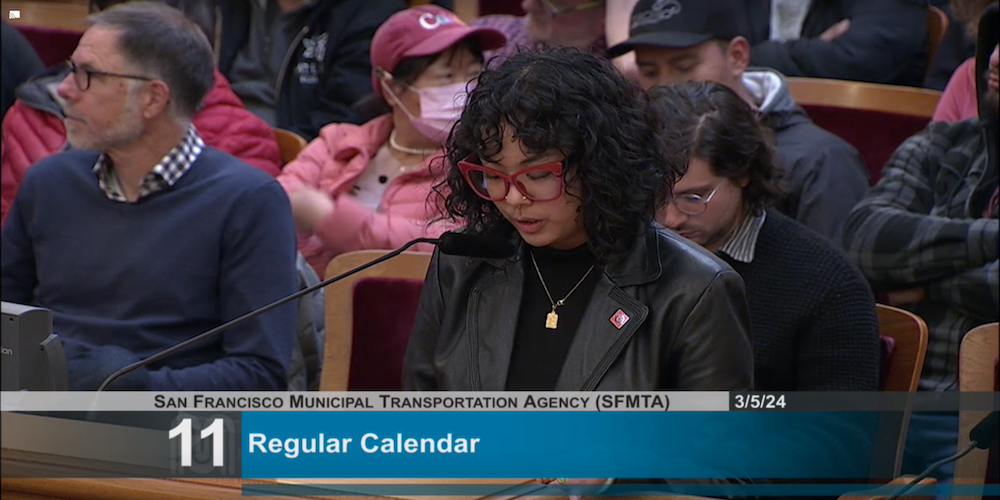
17th Street protected bike lanes passed!
Read about this member-led effort to connect our city's bike network.
-
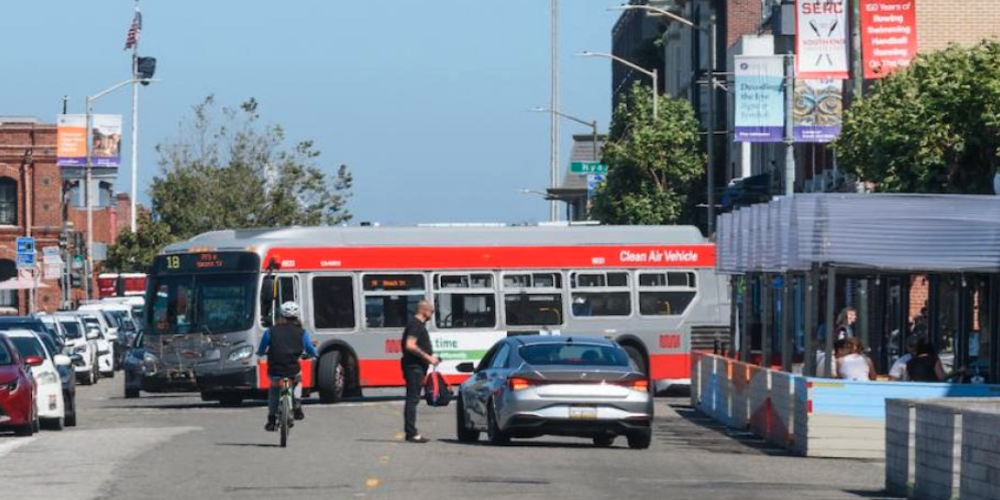
Protected bike lanes are coming to Beach Street!
Stay updated on the Beach Street quick-build.
-
WHAT'S NEXT FOR VALENCIA?
Stay updated on what's to come for the Valencia pilot project.
-
 All the basics — from maps and wayfinding, to how to lock your bike, to what to do if you’re in a crash.
-
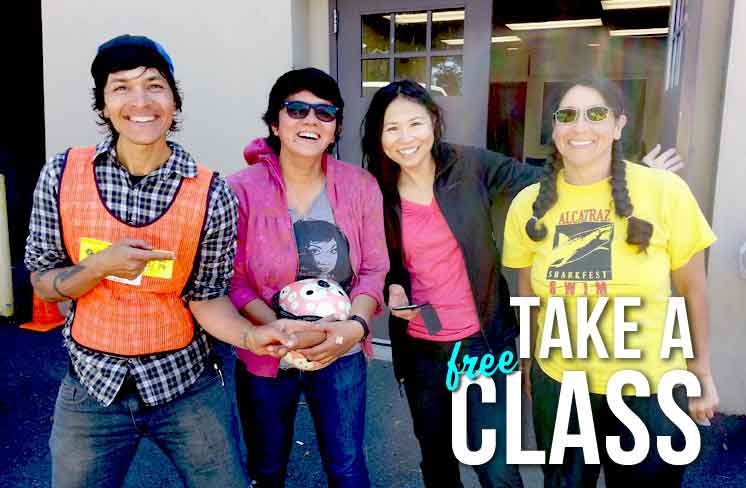 Want to start biking in San Francisco? Take a free urban bicycling class and get rolling.
-
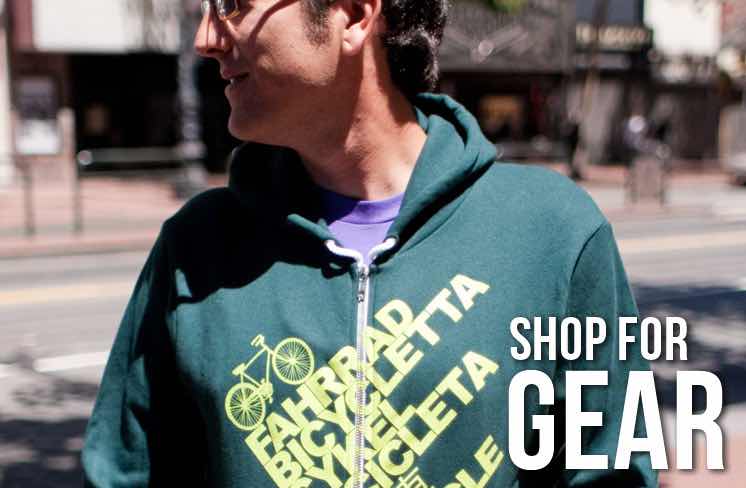 Show Your SF Bicycle Coalition Pride! Shop for awesome merch here.
-
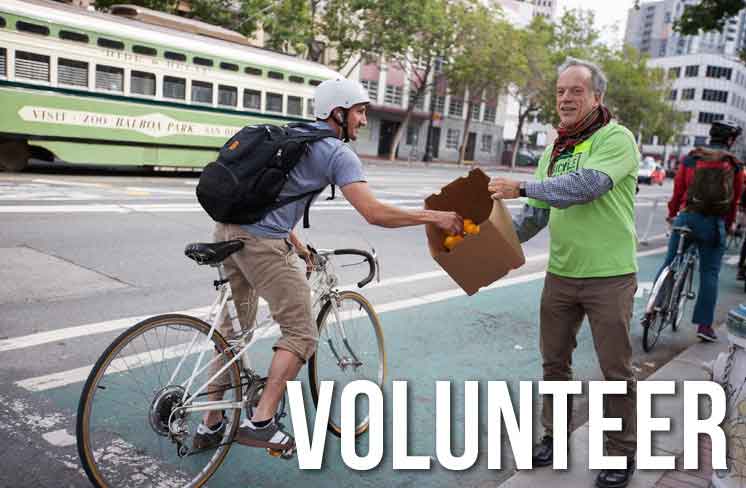 Improve your ride and your city when you volunteer with the San Francisco Bicycle Coalition.